Sankey Diagrams. A Dynamic view of the data
Sankey diagrams: a Dynamic view of the data.
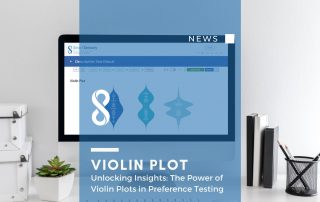
Unlocking Insights: The Power of Violin Plots in Preference Testing
Discover how violin plots revolutionize preference testing analysis, providing intuitive insights into data distributions. Learn why they outshine traditional box plots, making data interpretation accessible to all.
At the Forefront of Sensory Science: The 8th National SISS Conference in Alghero
The 8th National Conference of the Italian Society of Sensory Science (SISS) is an opportunity to explore the latest innovations in the field of sensory science and to win prestigious awards for young researchers.
15th Pangborn Sensory Science Symposium
Smart Sensory Solutions next stop, France. 15th Pangborn Sensory Science Symposium. Meeting new challenges in a changing world
AEPAS Congress
Smart Sensory Solutions team is heading to Girona, Catalonia, for the 5th congress of the Spanish Association of Sensory Analysis Professionals (AEPAS)
Event Calendar 2023
Explore the event calendar. 2023 will be a year full of meetings and conferences.
What you really need to start a sensory analysis program.
We’ve split up the list of important items to kickstart a sensory program. Here they are, listed in order of priority to start a sensory analysis program: budget, booths, software, skills.
See you at CIBUSTec Forum 2022 | Parma
A delegation from Smart Sensory Solutions also participates in this great event.
EuroSense 2022 is coming!
We invite you to join us at EuroSense 2022, during this event we will present the latest innovations about our software and our new brand image!
New release and a cool new logo for Smart Sensory Solutions.
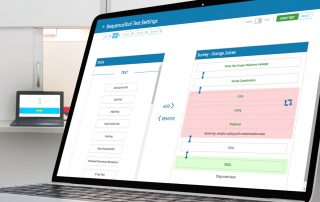
We needed to tell the world about the other side of our product: the web version, cloud computing, Internet of Senses and consultancy services.
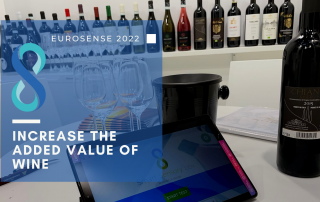
Sensory analysis drives sales? A clever use of consumer analysis techniques
How to increase the added value of your wine? Sensory analysis drives sales of Chianti organic wine in Brazil.
Ready for the 4th AEPAS Conference in Spain.
This coming week, Smart Sensory box is off to La Rioja, the famous Spanish vineyard region, for the 4th Conference of the Spanish Association of Sensory Analysis professionals (AEPAS).
Sensory Science – VI SISS Congress 2022
Did you miss the VI Congress of the Italian Sensory Science Society? Read this short but dense recap by our friend Giovanna Paiosin from Sensorial Alimentos.
ProWein – Smart Sensory Box
Smart Sensory box will attend the fair in partnership with Cantina Sorelli a winery based in Tuscany. This method allows the company to collect valuable information for the production and marketing departments.
Sensory evaluation of Olive Oil, legal requirements and competitive advantages.
Extra virgin olive oil is no longer perceived only as an identity product of the cuisine of some Mediterranean countries. The consumer seeks information on the sensory experience he will have when consuming the product.
Our Sensory Science events for 2022
Come and meet us (in person, finally!) As things hopefully start going back to normal, here are the next sensory science events we’re going to take part to. Sensory Science events [...]
Remote Sensory testing: some findings
An Italian research group published an article on remote sensory and consumer testing: here is a short resume
Pushing through the pandemic. New features.
2021 has brought us new features, new clients and a lot of good ideas for the future New Features - Everything You Need to Know. These last 12 months, with the COVID-19 pandemic showing [...]
Sensory Analysis Lab, how to get the best performance?
Here is a series of practical requirements to equip a Sensory Analysis Lab for high performance food testing
Sensory analysis mistakes: how to avoid them
Mistakes in sensory analysis occur. In this article we’ll show how to avoid being tricked by your senses
The sensory analysis toolbox: how to choose the right sensory and consumer test
Each sensory and consumer test will draw specific results. We’ll explain how to build your ideal sensory analysis toolbox
Senses, tastes, perceptions: introduction to sensory and consumer analysis
Senses heavily influence our lives, including our purchasing choices. But how can we understand this process? By using sensory and consumer analysis
