Recruit
Turn people into a qualified consumer panel
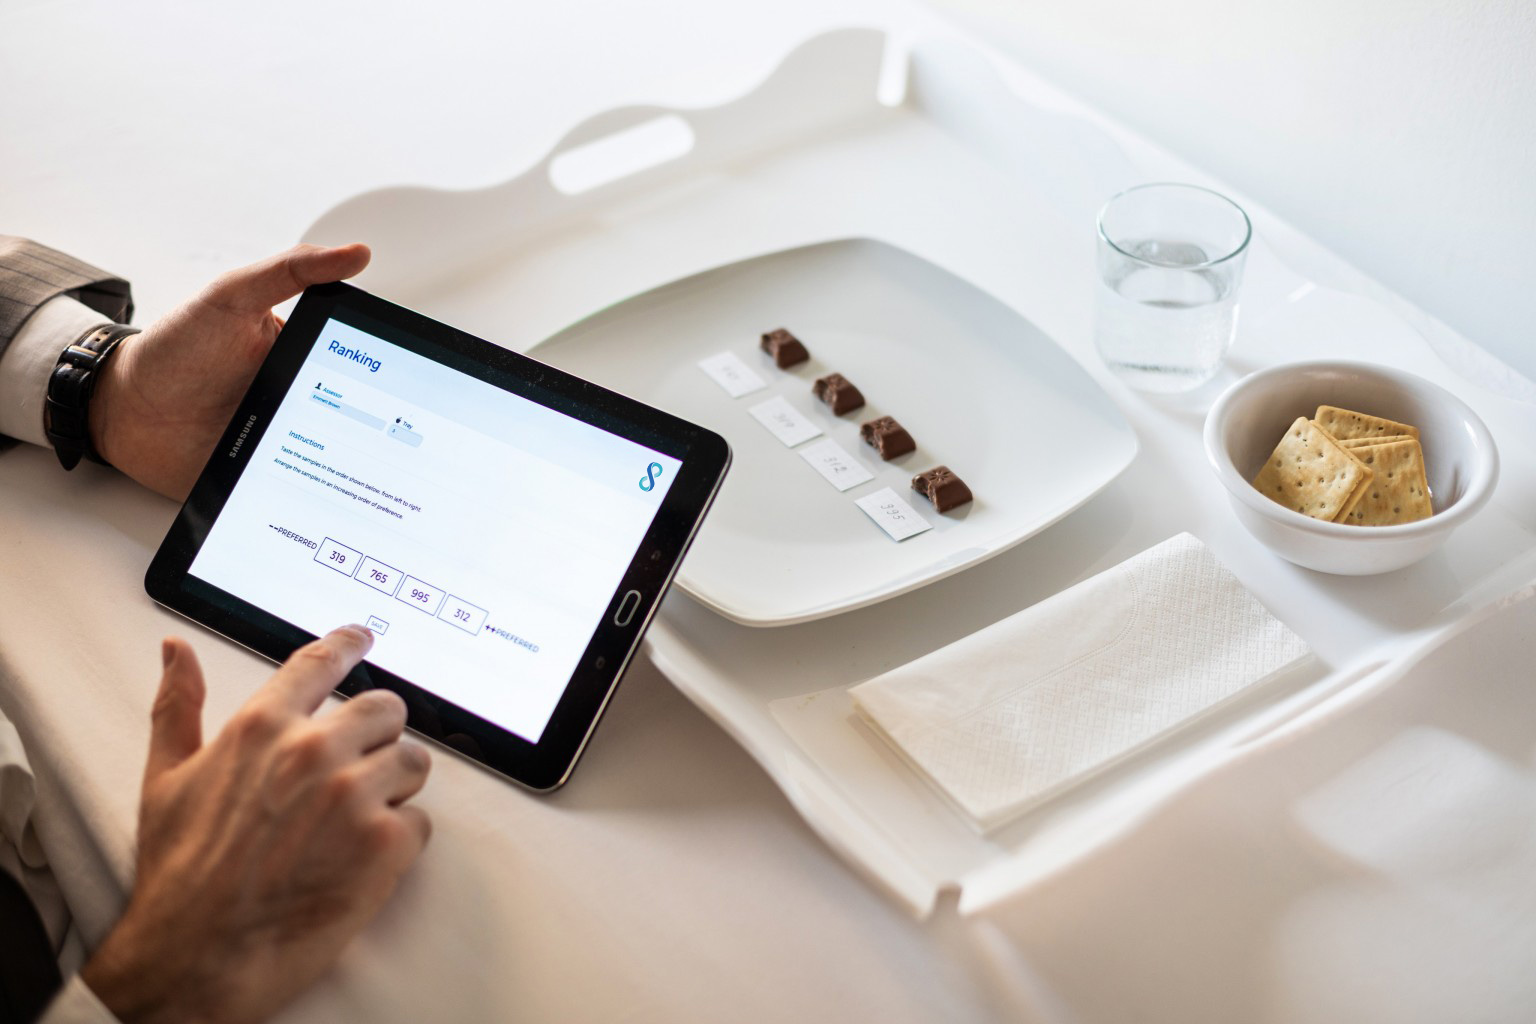
Recruit people everywhere and build your balanced panel based on your experimental design: demographics, allergies, testing sites and product expertise information.
Select and train your panel, monitor its performance and manage rewards with our dedicated tools.
Understand
Discover how your customers react to your product
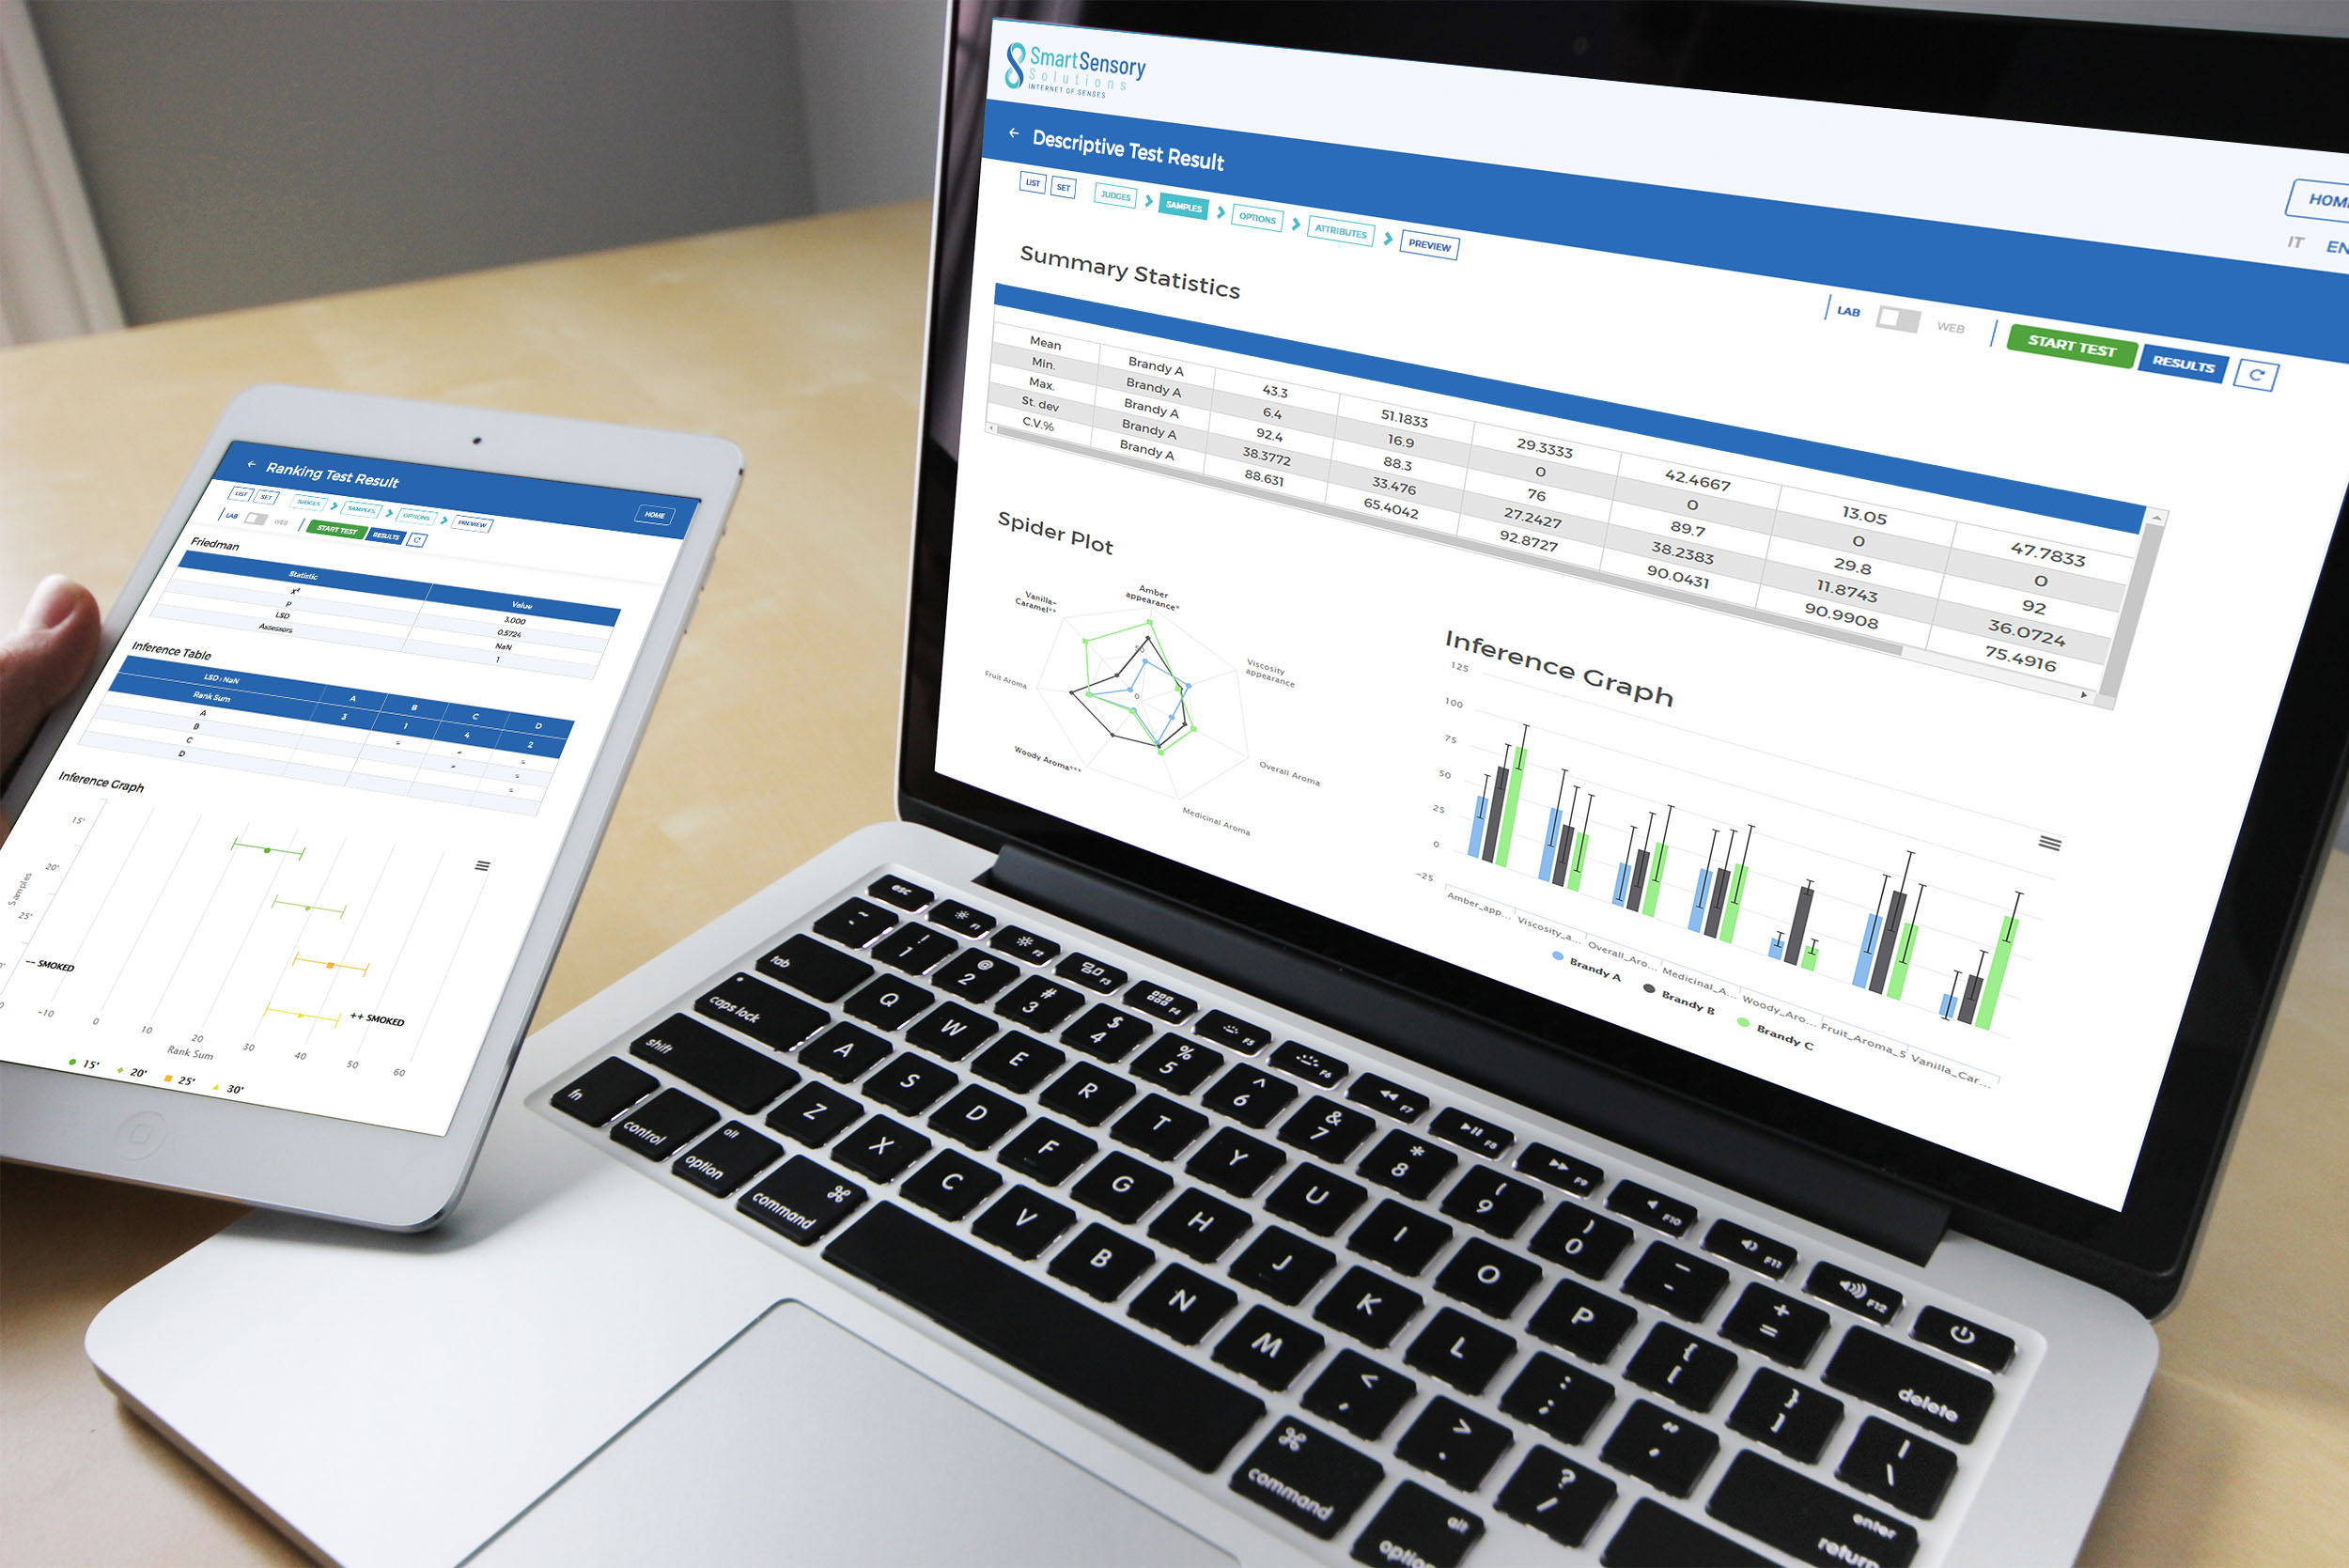
Data are collected and statistically analyzed in real-time based on the specific sensory and consumer test applied.
Results are summarized in clear statistical tables and visualized on intuitive charts in order to effectively support your decision-making process.
Customizable
The tailor-made solution that best fits your needs
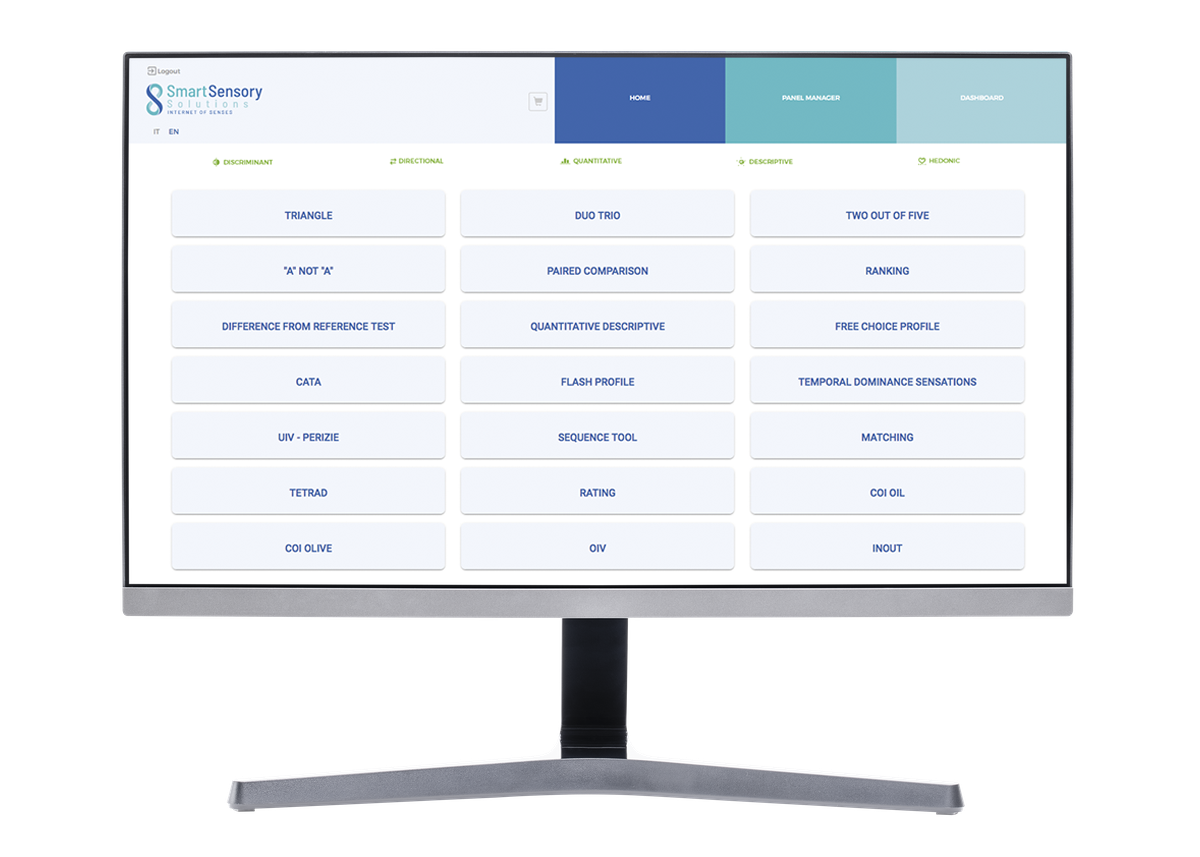
Smart Sensory Solutions is the only modular software that allows you to choose only the tests that you need, saving money and avoiding complexity.
All the test methods are designed to work independently. Use them to collect immediately your data or just drag-and-drop the modules in a sequence to create structured questionnaires/survey.
Powerful
Run Sensory and Consumer test everywhere
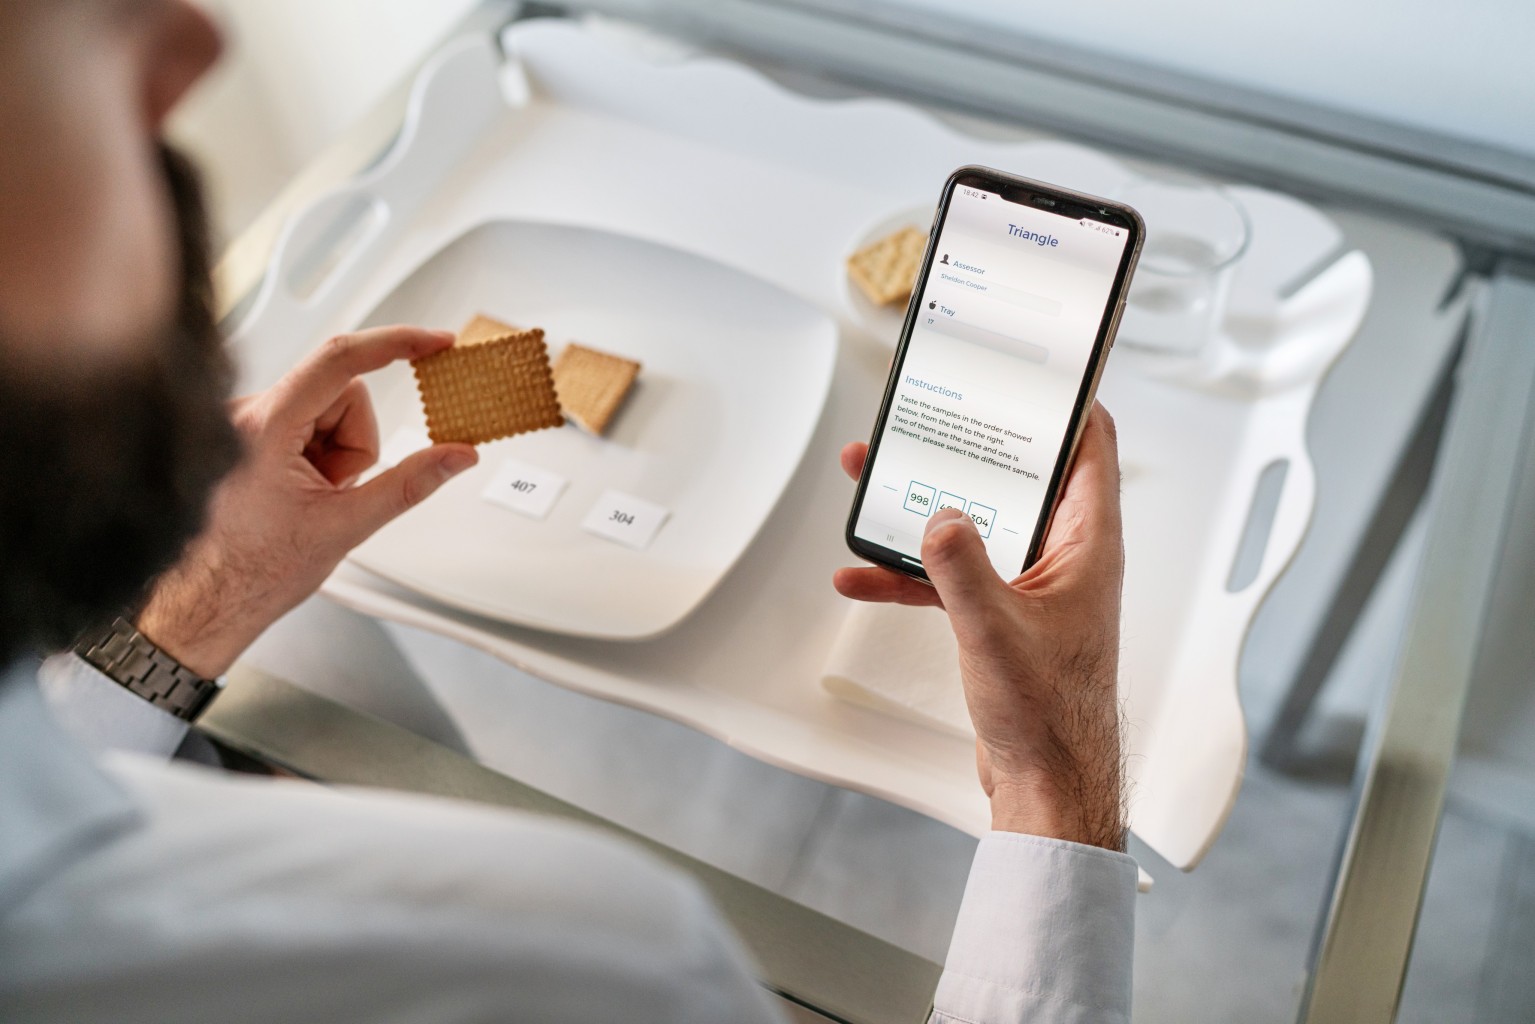
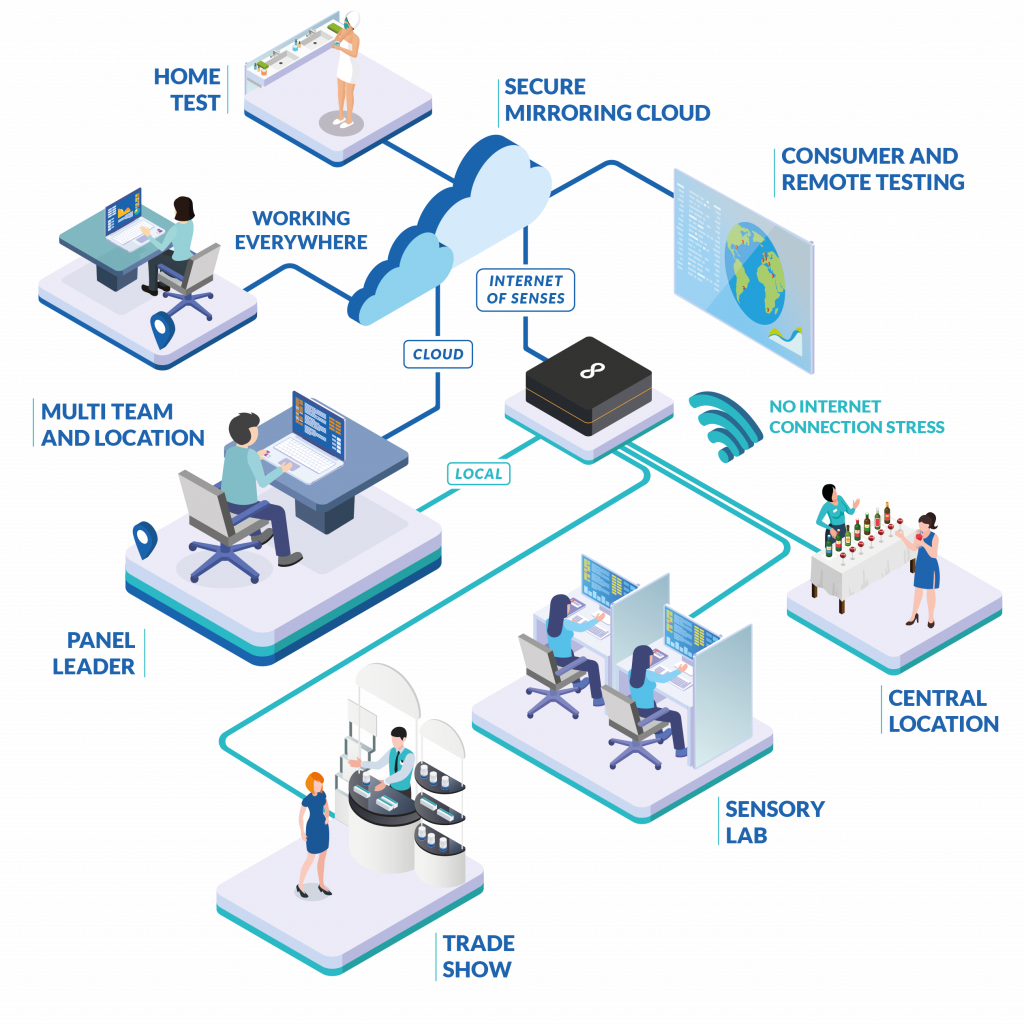
Full cloud, full local or a combined system, Smart Sensory box is your portable sensory lab, test your products everywhere, from the lab to the street.
Turn any device into a powerful testing station and any person into a qualified consumer panelist.
The statistical results are showed in clear and intuitive graphs and tables.

Cloud, Offline or Hybrid
Select your operating mode: cloud, offline or hybrid setup.
Our software can be deployed in three ways: in cloud, offline or through a hybrid system. Customize your dashboard by installing only the test methods that you need and start to easily collect data everywhere, on any device. From laboratory use to home-tests. Ready to go without any additional software or technical assistance required from your IT department.
